Research
Boundary Regression Model
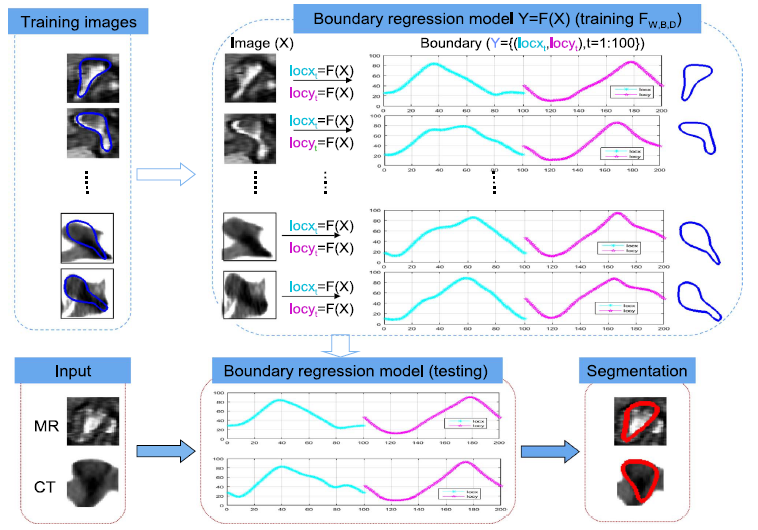
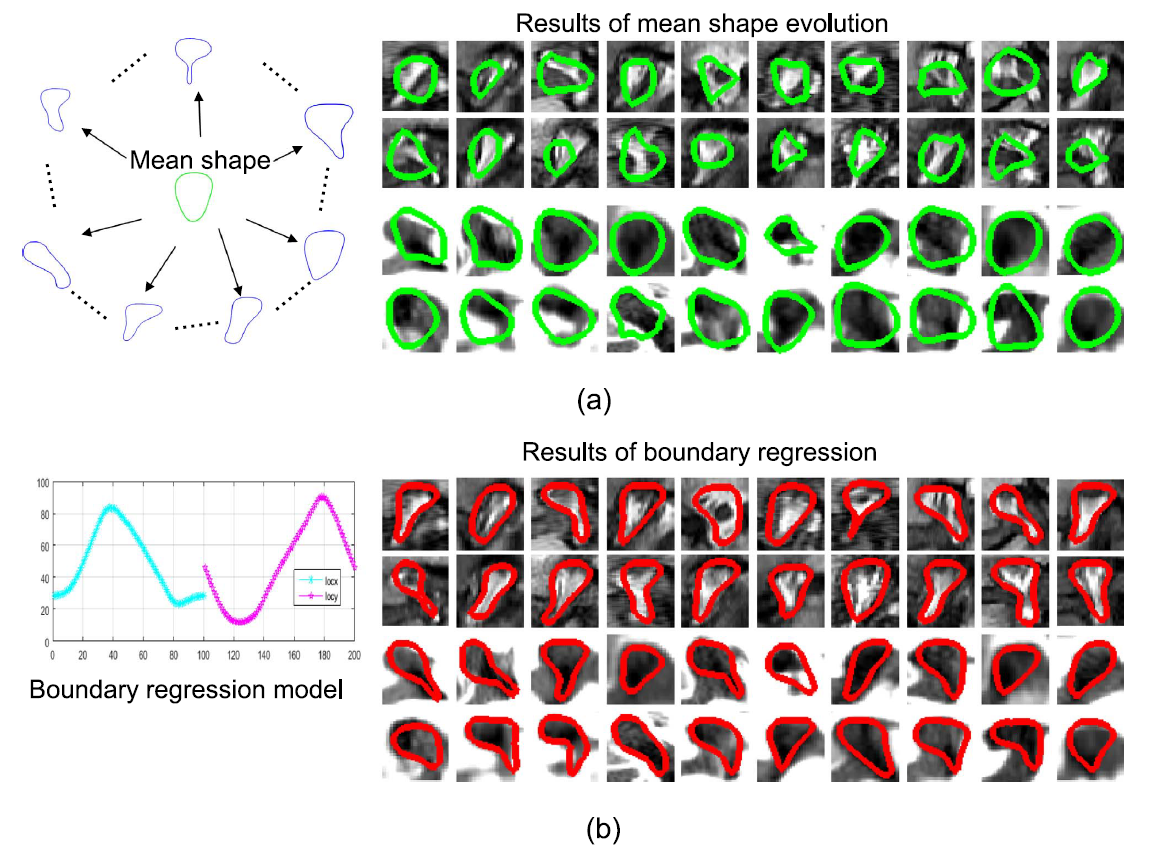
We propose a novel boundary regression segmentation framework for fully automated, multi-modal segmentation and area estimation of neural foramina.
- Combines multiple output support vector regression and multiple kernel learning.[1]
Synchronized Superpixels Representation (SSR)
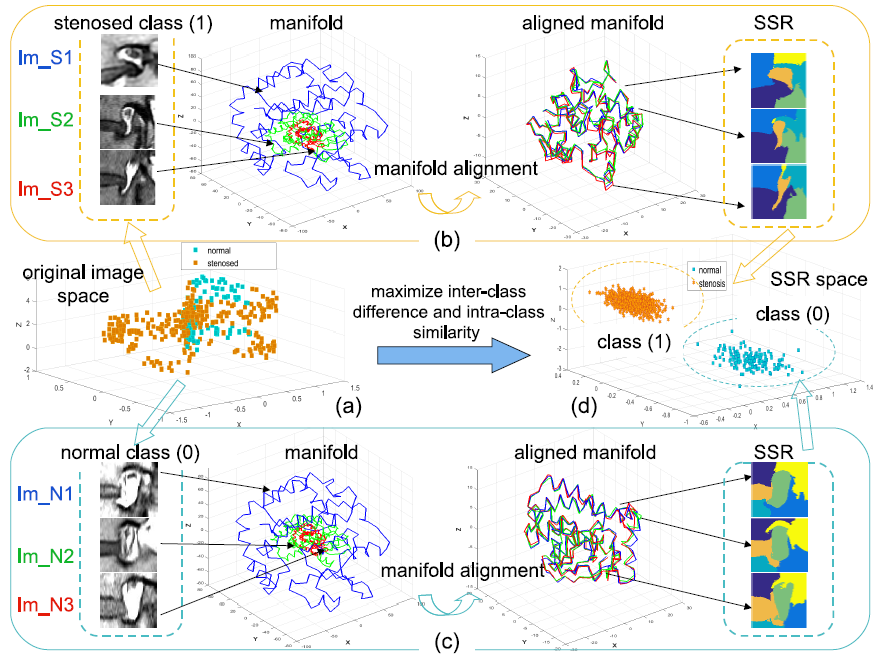
Fig. 1. SSR model, implemented by integrating class label (0:normal,1:stenosed) into manifold alignment, provides a discriminative feature space (called SSR space) for reliable classification. (a) the class overlapping problem in original image space; (b) stenosed SSR; (c) normal SSR; (d) SSR space.[2]
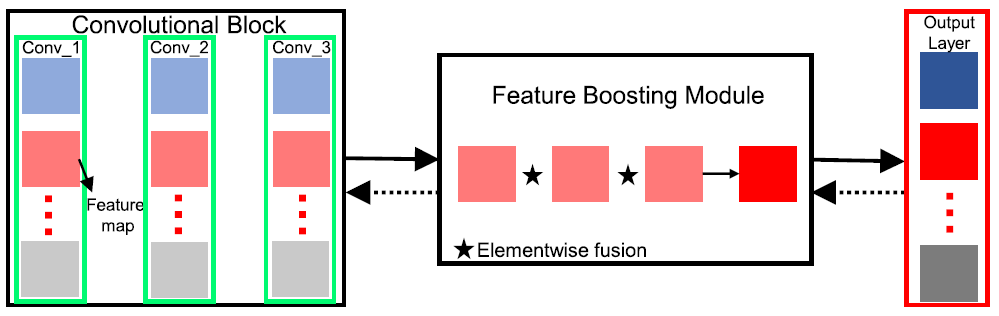
Deep Multiscale Multitask Learning Network (DMML-Net)
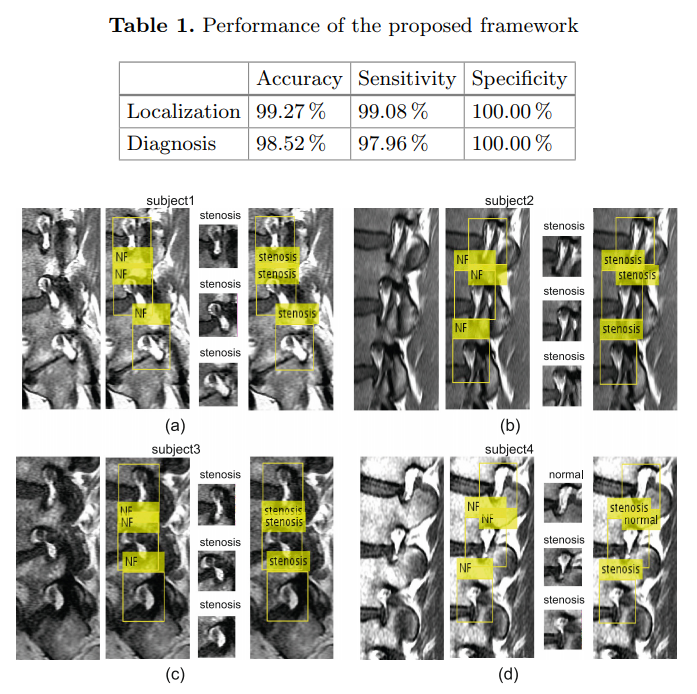
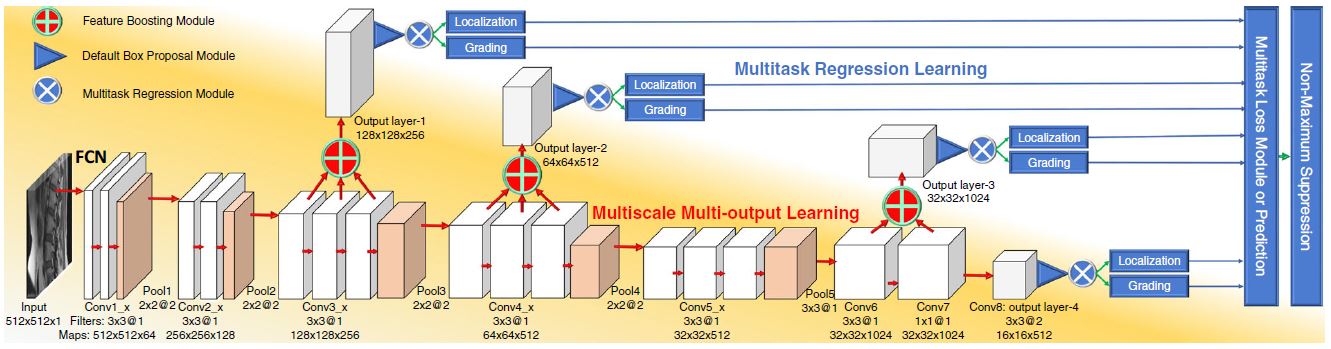
We propose a newly designed DMML-Net integrating multi-output learning and multitask regression learning into a fully convolutional network.[3]
- Robustly represents spinal structures and reinforces the salience of target organs due to a feature boosting module merging semantic multi-level features.
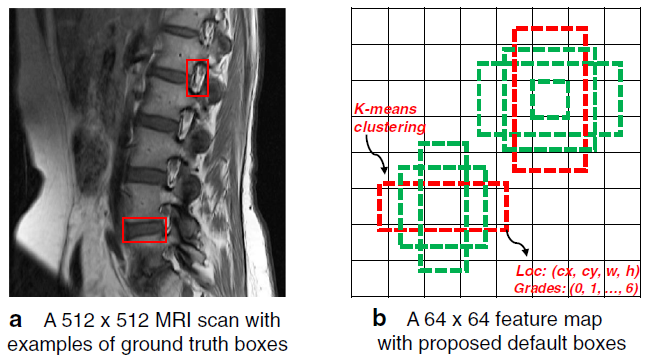
- Capable of scale-invariance for various organs due to a k-means clustering method finding the rule of organs.
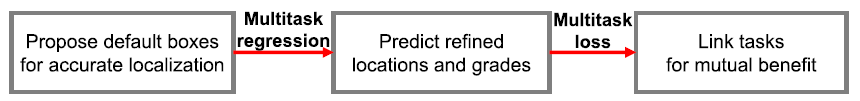
- Promotes mutual benefit between inter-task and intra-task due to multitask regression and multitask loss modules.[3]

Fig. 2. DMML-Net directly localizes and grades all lumbar organs after importing clinical lumbar MRI scans. Multiscale multi-output learning predicts target organs at many convolutional layers of an FCN. Multitask regression learning links multiple tasks with parameter sharing for mutual benefit[3]